日本企业物价指数 Slides
制作一张精美的 16:9 日本信息图表 Slides,用于总结 2026 年 6 月企业商品物价指数统计数据,适用于商务或经济演示。
- Category
- Charts & Infographics
- Model
- GPT Image 2
- Creator
- ちょこ雑
- Source language
- en
- Source ID
- 28295
- Published
- Jul 10, 2026
Full prompt
Goal: Create a clean Japanese economic infographic slide summarizing the corporate goods price index速報 for {argument name="report month" default="2026年6月"}.

Canvas: 16:9 horizontal presentation slide, white background with very pale blue accents, ample margins, polished corporate report design. Use navy as the main text color and bright medium blue for numerical percentages. Add a small gray page number “01” at the bottom right.

Layout: Large headline at the top left reading “企業物価指数、{argument name="report month" default="2026年6月"}速報”. Directly below it, a blue subtitle reading “国内物価は前年比+7.1%、輸入物価は円ベースで+29.7%”. Center the main content as exactly 3 rounded rectangular statistic cards in one horizontal row, each with a light blue border, subtle shadow, faint blue gradient fill, a circular icon area at top left, a bold Japanese category title, a thin divider line, and two metric rows. At the bottom, place a small friendly white-and-blue robot mascot on the lower left, pointing upward, and a centered conclusion sentence.

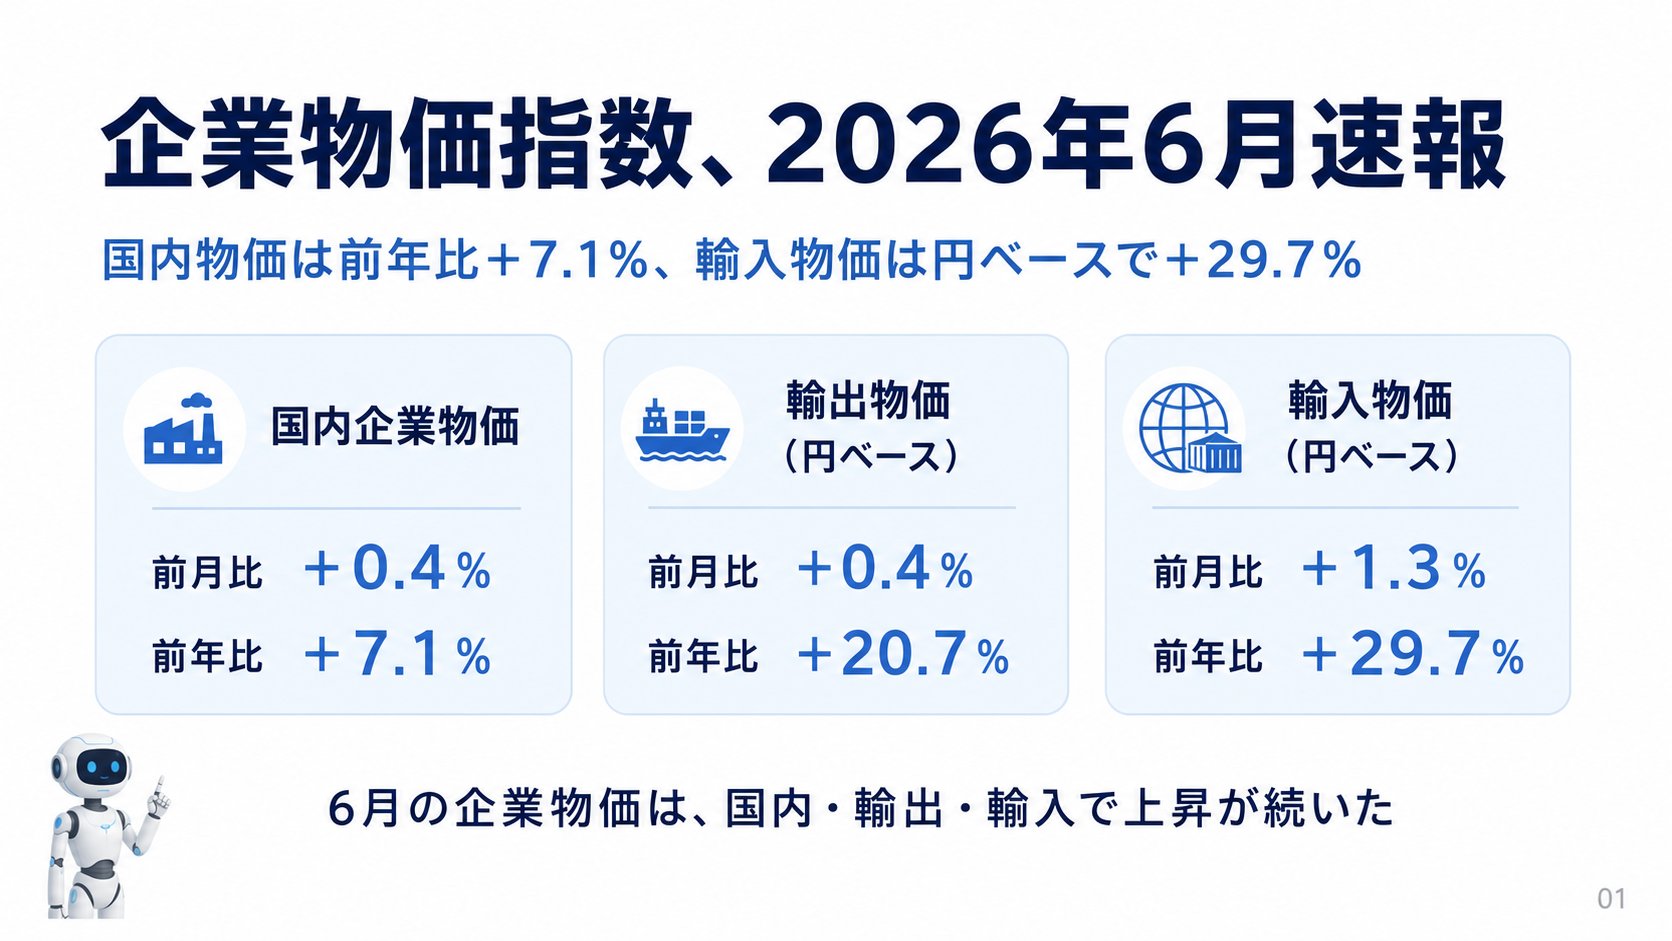
Statistic cards: Use exactly 3 cards. Card 1: factory icon, title “国内企業物価”, metric rows “前月比 +0.4%” and “前年比 +7.1%”. Card 2: cargo ship icon, title “輸出物価(円ベース)”, metric rows “前月比 +0.4%” and “前年比 +20.7%”. Card 3: globe and container/warehouse icon, title “輸入物価(円ベース)”, metric rows “前月比 +1.3%” and “前年比 +29.7%”. Make the percentages large and bright blue, aligned to the right of each row label.

Bottom text: Centered near the bottom in bold navy Japanese: “6月の企業物価は、国内・輸出・輸入で上昇が続いた”.

Visual style: Modern Japanese business presentation, crisp vector icons, rounded corners, soft shadows, balanced whitespace, consistent alignment. No charts or extra decorations beyond the 3 cards, the robot mascot, and page number. Keep all Japanese text legible and exactly as specified.
Translations
日本企业物价指数 Slides
enGoal: Create a clean Japanese economic infographic slide summarizing the corporate goods price index速報 for {argument name="report month" default="2026年6月"}. Canvas: 16:9 horizontal presentation slide, white background with very pale blue accents, ample margins, polished corporate report design. Use navy as the main text color and bright medium blue for numerical percentages. Add a small gray page number “01” at the bottom right. Layout: Large headline at the top left reading “企業物価指数、{argument name="report month" default="2026年6月"}速報”. Directly below it, a blue subtitle reading “国内物価は前年比+7.1%、輸入物価は円ベースで+29.7%”. Center the main content as exactly 3 rounded rectangular statistic cards in one horizontal row, each with a light blue border, subtle shadow, faint blue gradient fill, a circular icon area at top left, a bold Japanese category title, a thin divider line, and two metric rows. At the bottom, place a small friendly white-and-blue robot mascot on the lower left, pointing upward, and a centered conclusion sentence. Statistic cards: Use exactly 3 cards. Card 1: factory icon, title “国内企業物価”, metric rows “前月比 +0.4%” and “前年比 +7.1%”. Card 2: cargo ship icon, title “輸出物価(円ベース)”, metric rows “前月比 +0.4%” and “前年比 +20.7%”. Card 3: globe and container/warehouse icon, title “輸入物価(円ベース)”, metric rows “前月比 +1.3%” and “前年比 +29.7%”. Make the percentages large and bright blue, aligned to the right of each row label. Bottom text: Centered near the bottom in bold navy Japanese: “6月の企業物価は、国内・輸出・輸入で上昇が続いた”. Visual style: Modern Japanese business presentation, crisp vector icons, rounded corners, soft shadows, balanced whitespace, consistent alignment. No charts or extra decorations beyond the 3 cards, the robot mascot, and page number. Keep all Japanese text legible and exactly as specified.
日本企业物价指数 Slides
zh-CN目标:制作一张简洁的日本经济信息图表 Slides,总结 {argument name="report month" default="2026年6月"} 的企业商品物价指数速报。 画布:16:9 横向演示幻灯片,白色背景,带有极浅的蓝色点缀,留白充足,采用精美的企业报告设计。主文本颜色使用深蓝色,数值百分比使用明亮的中蓝色。在右下角添加一个灰色的小页码“01”。 布局:左上角放置大标题“企业物价指数,{argument name="report month" default="2026年6月"}速报”。其正下方放置蓝色副标题“国内物价は前年比+7.1%、输入物价は円ベースで+29.7%”。主要内容居中,横向排列 3 张圆角矩形统计卡片,每张卡片带有浅蓝色边框、细微阴影、淡蓝色渐变填充,左上角设有圆形图标区域,包含粗体日文类别标题、细分割线以及两行指标数据。底部左侧放置一个友好的白蓝配色机器人吉祥物,指向右上方,底部居中位置放置一句总结性语句。 统计卡片:使用 3 张卡片。卡片 1:工厂图标,标题“国内企业物价”,指标行“前月比 +0.4%”和“前年比 +7.1%”。卡片 2:货船图标,标题“输出物价(円ベース)”,指标行“前月比 +0.4%”和“前年比 +20.7%”。卡片 3:地球与集装箱/仓库图标,标题“输入物价(円ベース)”,指标行“前月比 +1.3%”和“前年比 +29.7%”。百分比数值需放大并显示为明亮的蓝色,与每行标签右侧对齐。 底部文本:底部居中处使用粗体深蓝色日文:“6月の企业物价は、国内・输出・输入で上昇が続いた”。 视觉风格:现代日本商务演示风格,清晰的矢量图标,圆角设计,柔和阴影,平衡的留白,一致的对齐方式。除 3 张卡片、机器人吉祥物和页码外,无需图表或其他额外装饰。保持所有日文文本清晰易读,并严格按照指定内容呈现。