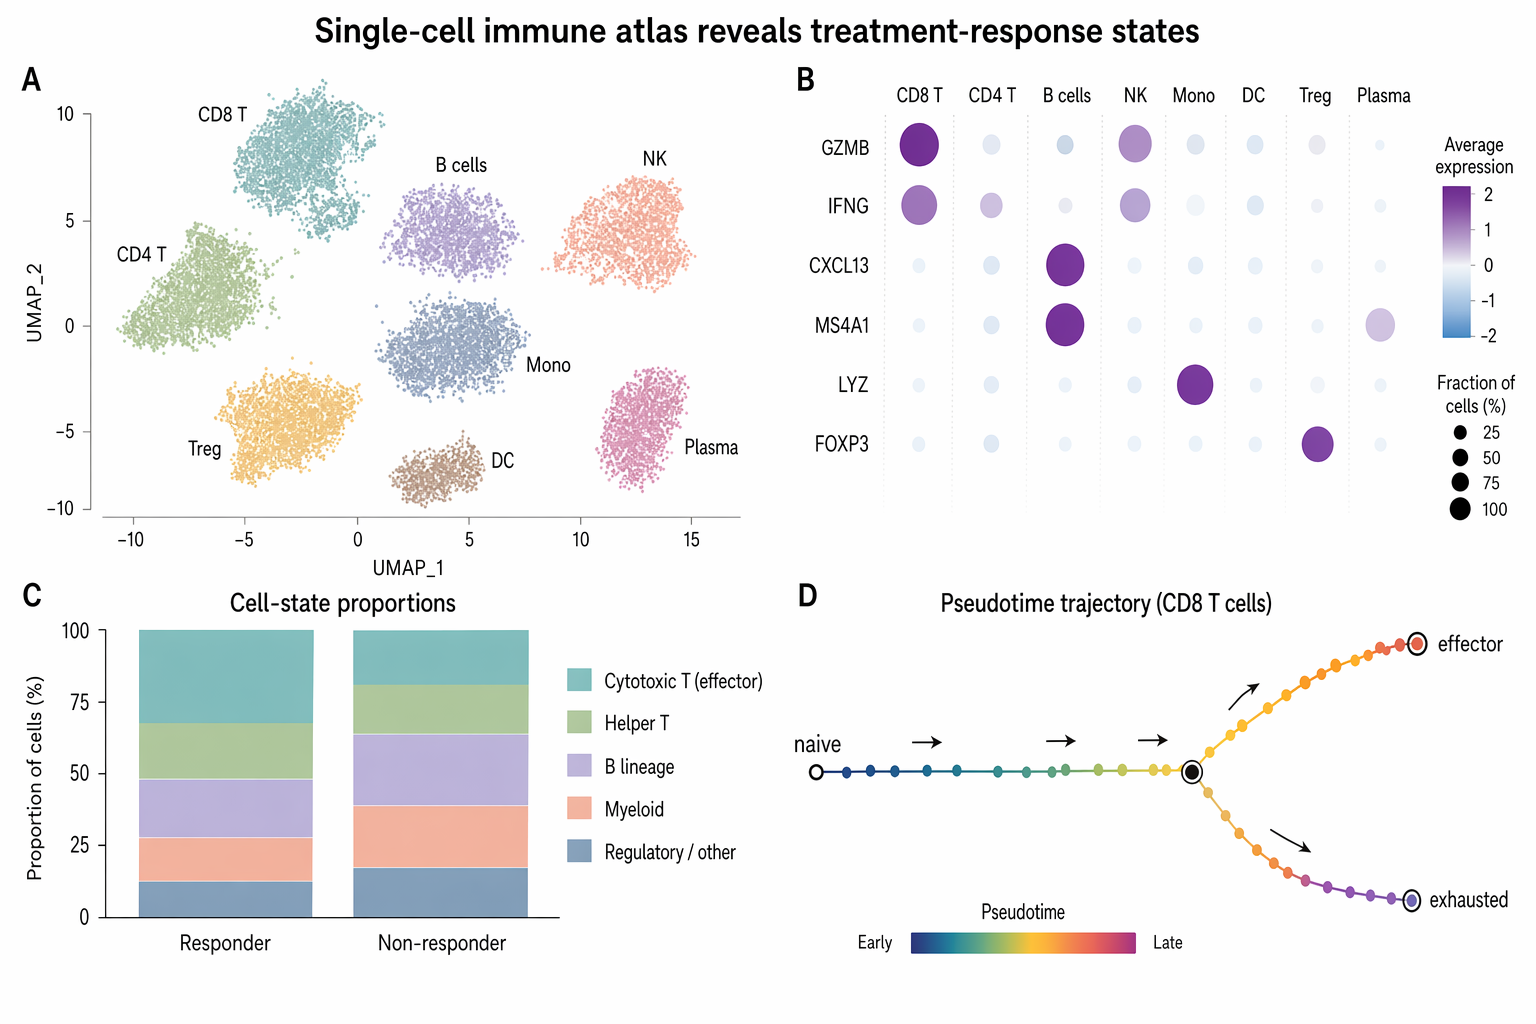
Single-cell immune atlas reveals treatment-response states
Create a polished Nature / Cell style biomedical research figure, landscape 3:2 (1536×1024), soft minimal palette, publication-ready. Figure title: "Single-cell immune atlas revea
- 分类
- 图表信息图
- 模型
- GPT Image 2
- 来源作者
- wuyoscar
- 原始语言
- en
- 来源 ID
- 076
完整提示词
Create a polished Nature / Cell style biomedical research figure, landscape 3:2 (1536×1024), soft minimal palette, publication-ready.

Figure title: "Single-cell immune atlas reveals treatment-response states".

Layout: 4-panel figure labeled A–D.
A. Large UMAP scatter plot with 8 softly colored immune clusters; labels: "CD8 T", "CD4 T", "B cells", "NK", "Mono", "DC", "Treg", "Plasma". Use pastel teal, sage, lavender, peach, slate, amber.
B. Dot plot of marker genes with rows "GZMB", "IFNG", "CXCL13", "MS4A1", "LYZ", "FOXP3" and columns matching immune clusters; dot size = fraction, color = expression.
C. Small stacked bar chart comparing "Responder" vs "Non-responder" cell-state proportions, with 5 muted segments and a tidy legend.
D. Pseudotime trajectory diagram: a clean branching curve from "naive" to "effector" and "exhausted", with small arrows and gradient color.

Style requirements: literature-science design, white background, thin gray axes, compact legends, readable micro-labels, restrained typography, soft colors, elegant spacing, no 3D, no glossy UI, no fake journal logo, no watermark.
多语言版本
Single-cell immune atlas reveals treatment-response states
enCreate a polished Nature / Cell style biomedical research figure, landscape 3:2 (1536×1024), soft minimal palette, publication-ready. Figure title: "Single-cell immune atlas reveals treatment-response states". Layout: 4-panel figure labeled A–D. A. Large UMAP scatter plot with 8 softly colored immune clusters; labels: "CD8 T", "CD4 T", "B cells", "NK", "Mono", "DC", "Treg", "Plasma". Use pastel teal, sage, lavender, peach, slate, amber. B. Dot plot of marker genes with rows "GZMB", "IFNG", "CXCL13", "MS4A1", "LYZ", "FOXP3" and columns matching immune clusters; dot size = fraction, color = expression. C. Small stacked bar chart comparing "Responder" vs "Non-responder" cell-state proportions, with 5 muted segments and a tidy legend. D. Pseudotime trajectory diagram: a clean branching curve from "naive" to "effector" and "exhausted", with small arrows and gradient color. Style requirements: literature-science design, white background, thin gray axes, compact legends, readable micro-labels, restrained typography, soft colors, elegant spacing, no 3D, no glossy UI, no fake journal logo, no watermark.