Small Multiples Climate Grid
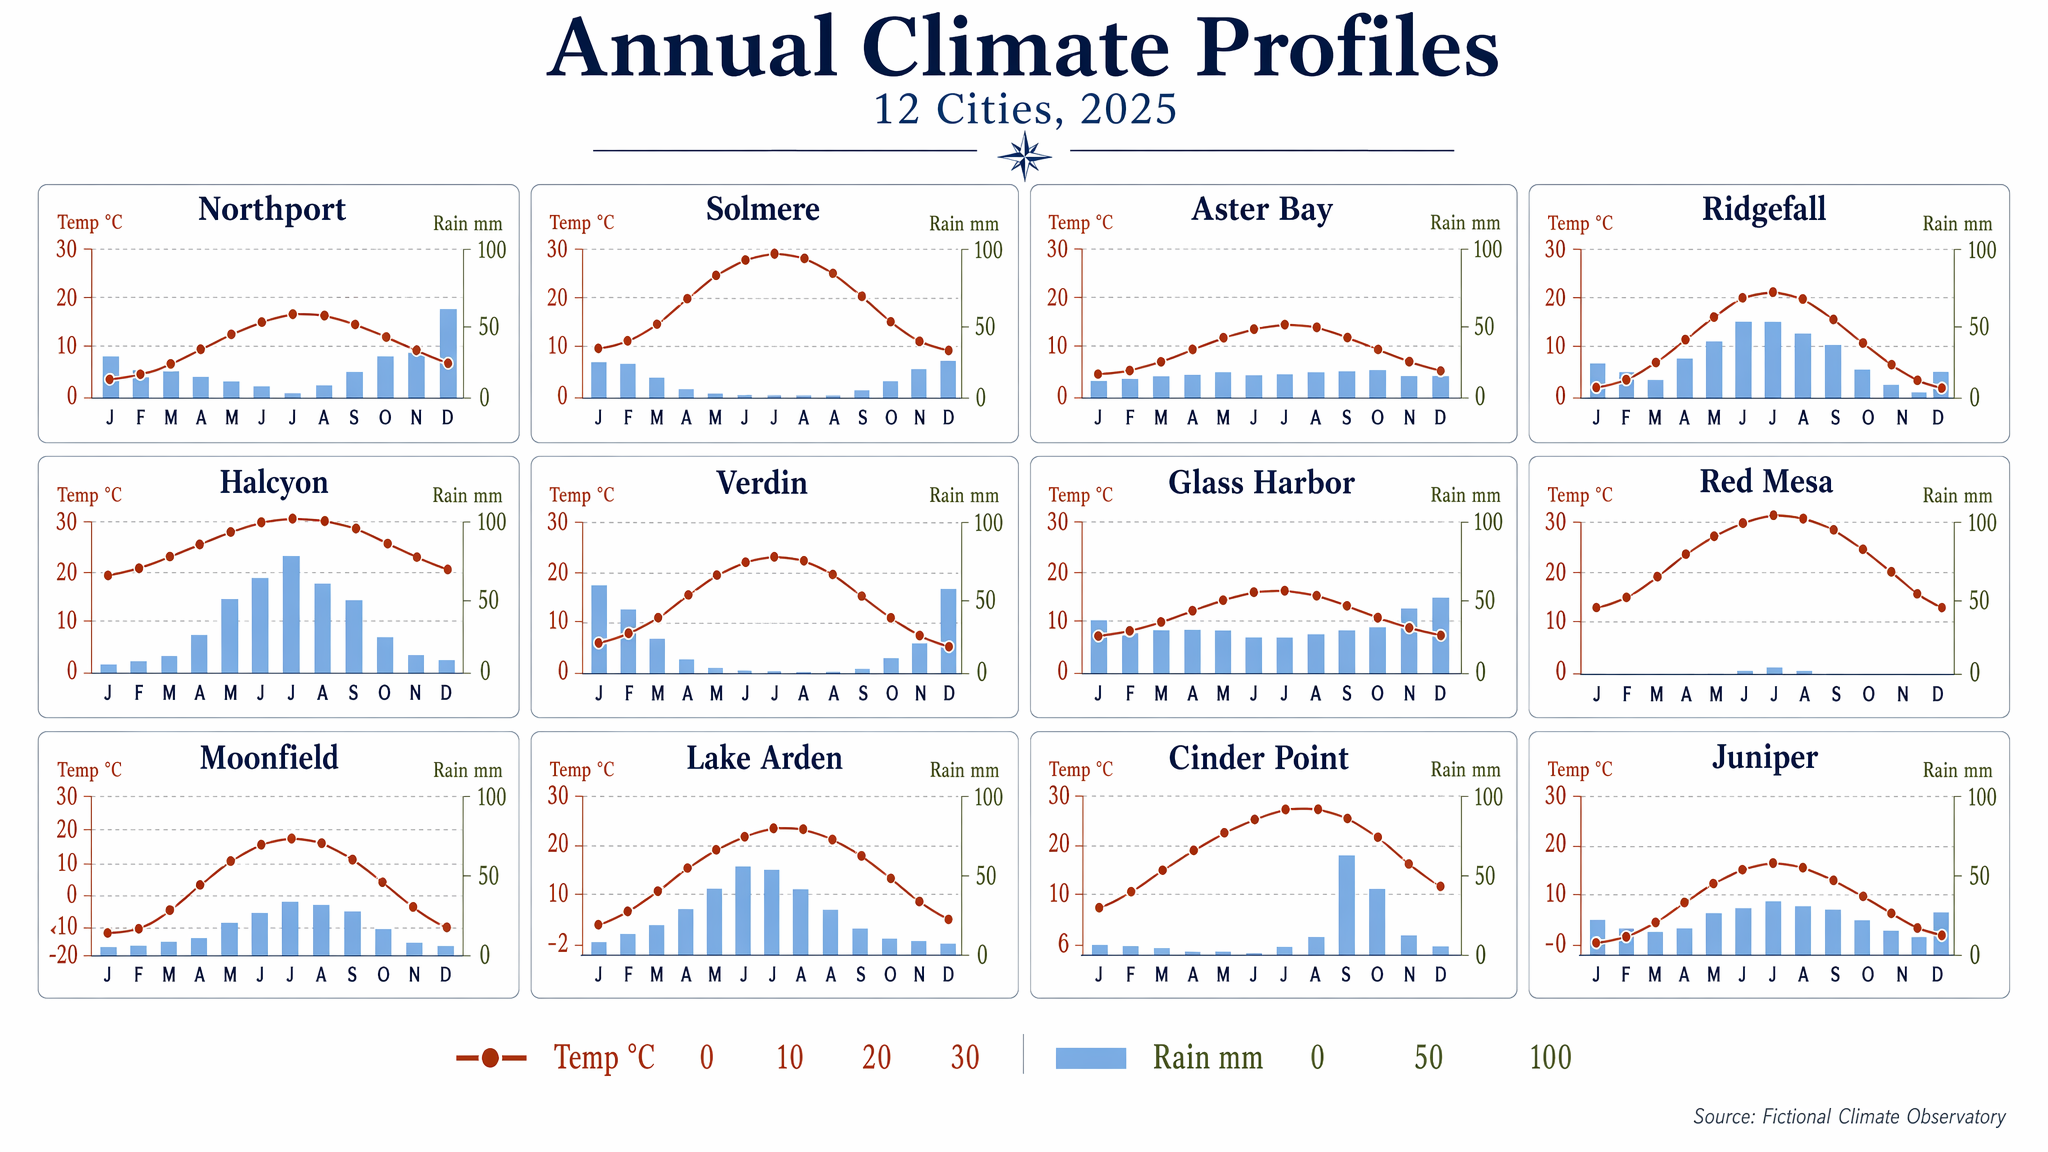
Produce a clean editorial data visualization poster showing a 4x3 small-multiples grid of monthly climate charts for 12 fictional cities. Use a white background, generous margins,
- 分类
- 图表信息图
- 模型
- GPT Image 2
- 来源作者
- wuyoscar
- 原始语言
- en
- 来源 ID
- 107
完整提示词
Produce a clean editorial data visualization poster showing a 4x3 small-multiples grid of monthly climate charts for 12 fictional cities. Use a white background, generous margins, and a restrained palette of navy, rust, sky blue, olive, and charcoal. Each mini-panel should contain a temperature line and precipitation bars with consistent axes and ultra-legible labels. Include a title block with the in-image text "Annual Climate Profiles" and subtitle "12 Cities, 2025". Label panels "Northport", "Solmere", "Aster Bay", "Ridgefall", "Halcyon", "Verdin", "Glass Harbor", "Red Mesa", "Moonfield", "Lake Arden", "Cinder Point", and "Juniper". Use month labels "J F M A M J J A S O N D" and axis labels "Temp °C" and "Rain mm". Add numeric legend values "0", "10", "20", "30", and "100". Keep the composition highly structured, scientifically clear, and visually elegant, with crisp typography, aligned scales, and publication-grade chart rendering.
多语言版本
Small Multiples Climate Grid
enProduce a clean editorial data visualization poster showing a 4x3 small-multiples grid of monthly climate charts for 12 fictional cities. Use a white background, generous margins, and a restrained palette of navy, rust, sky blue, olive, and charcoal. Each mini-panel should contain a temperature line and precipitation bars with consistent axes and ultra-legible labels. Include a title block with the in-image text "Annual Climate Profiles" and subtitle "12 Cities, 2025". Label panels "Northport", "Solmere", "Aster Bay", "Ridgefall", "Halcyon", "Verdin", "Glass Harbor", "Red Mesa", "Moonfield", "Lake Arden", "Cinder Point", and "Juniper". Use month labels "J F M A M J J A S O N D" and axis labels "Temp °C" and "Rain mm". Add numeric legend values "0", "10", "20", "30", and "100". Keep the composition highly structured, scientifically clear, and visually elegant, with crisp typography, aligned scales, and publication-grade chart rendering.