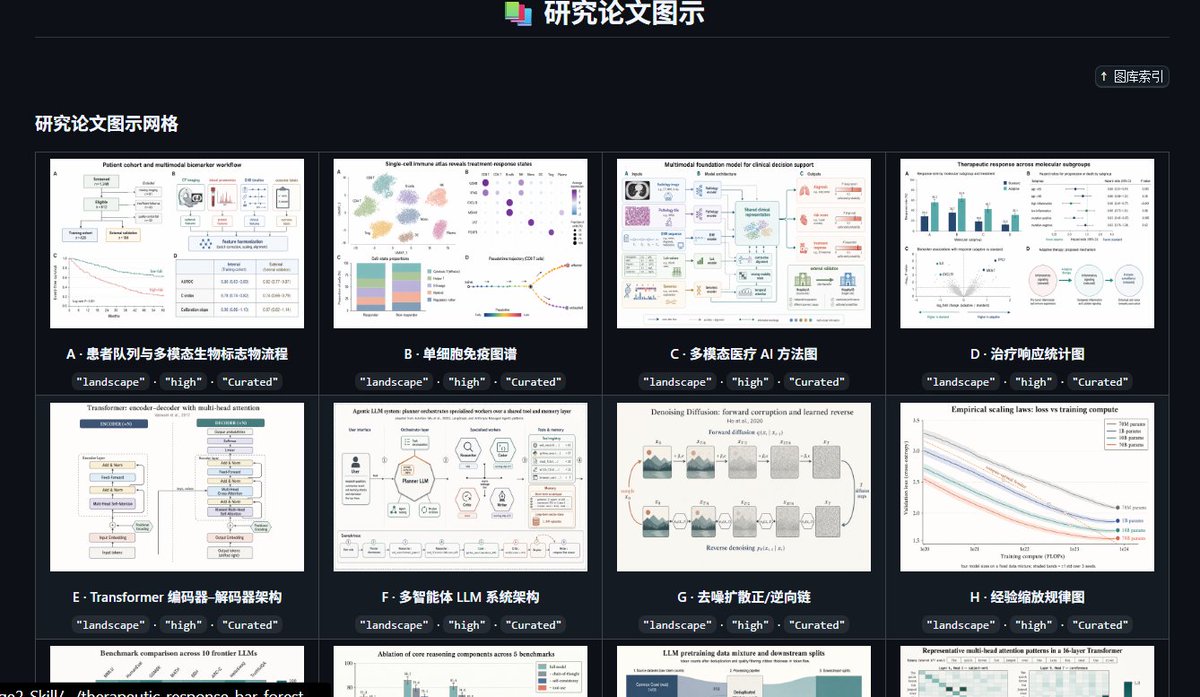
Therapeutic response bar and forest plot
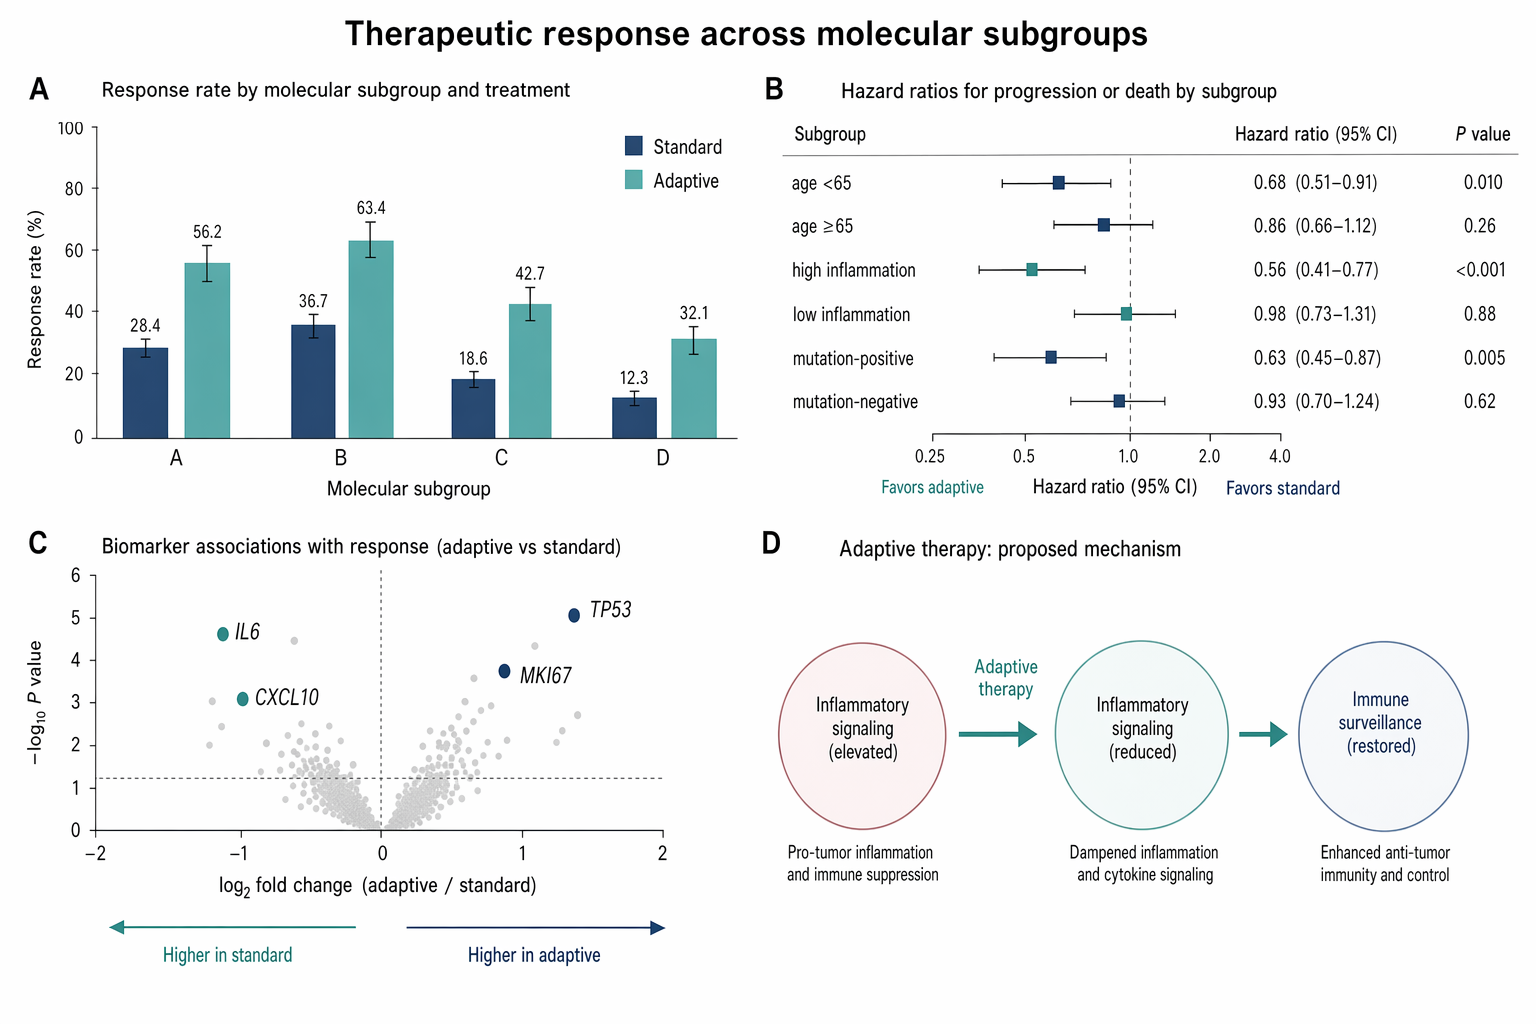
Create a Nature Medicine style statistical results figure, landscape 3:2 (1536×1024), soft, restrained, publication-quality. Figure title: "Therapeutic response across molecular s
- 分类
- 图表信息图
- 模型
- GPT Image 2
- 来源作者
- wuyoscar
- 原始语言
- en
- 来源 ID
- 078
完整提示词
Create a Nature Medicine style statistical results figure, landscape 3:2 (1536×1024), soft, restrained, publication-quality.

Figure title: "Therapeutic response across molecular subgroups".

Layout: 4-panel figure labeled A–D.
A. Grouped bar chart: response rate (%) for four subgroups "A", "B", "C", "D" across two treatments "standard" and "adaptive". Use muted navy and soft teal bars, thin error bars, numeric labels.
B. Forest plot of hazard ratios for subgroups with a vertical reference line at HR=1.0; rows "age <65", "age ≥65", "high inflammation", "low inflammation", "mutation-positive", "mutation-negative". Use small squares and confidence intervals.
C. Volcano-style biomarker association plot with pale gray background points and highlighted labeled markers "IL6", "CXCL10", "TP53", "MKI67".
D. Minimal mechanism schematic: adaptive therapy reduces inflammatory signaling and restores immune surveillance; use three clean nodes connected by arrows, no complex biology drawings.

Style requirements: literature-science aesthetic, white background, soft desaturated colors, thin gray axes, clear legends, compact labels, generous margins, Nature-style figure polish, no fake values that look too random, no decorative background, no watermark.
多语言版本
Therapeutic response bar and forest plot
enCreate a Nature Medicine style statistical results figure, landscape 3:2 (1536×1024), soft, restrained, publication-quality. Figure title: "Therapeutic response across molecular subgroups". Layout: 4-panel figure labeled A–D. A. Grouped bar chart: response rate (%) for four subgroups "A", "B", "C", "D" across two treatments "standard" and "adaptive". Use muted navy and soft teal bars, thin error bars, numeric labels. B. Forest plot of hazard ratios for subgroups with a vertical reference line at HR=1.0; rows "age <65", "age ≥65", "high inflammation", "low inflammation", "mutation-positive", "mutation-negative". Use small squares and confidence intervals. C. Volcano-style biomarker association plot with pale gray background points and highlighted labeled markers "IL6", "CXCL10", "TP53", "MKI67". D. Minimal mechanism schematic: adaptive therapy reduces inflammatory signaling and restores immune surveillance; use three clean nodes connected by arrows, no complex biology drawings. Style requirements: literature-science aesthetic, white background, soft desaturated colors, thin gray axes, clear legends, compact labels, generous margins, Nature-style figure polish, no fake values that look too random, no decorative background, no watermark.